Crafting Data-Driven Dashboards: A Step-by-Step Guide
Your Guide to Creating Dashboards That Deliver
In my eight years as an analytics professional, I’ve learned that creating effective dashboards is not just about putting a few charts together. It’s about building an output that provides real value.
So how do you go about this process?
Here’s a step-by-step guide to help you create dashboards that not only look good but also deliver actionable insights.
Start with the user
This is going to sound obvious but you will be surprised at the number of times I’ve come across dashboards that are not useful. And most times those dashboards are not useful because the creator made something from their POV and not the user’s.
The first step in creating effective dashboards is knowing who the end user is going to be
Who are they? Which team do they belong to?
What are their needs? What questions are they trying to answer?
Once you have a good sense of your stakeholders it’s time to start building.
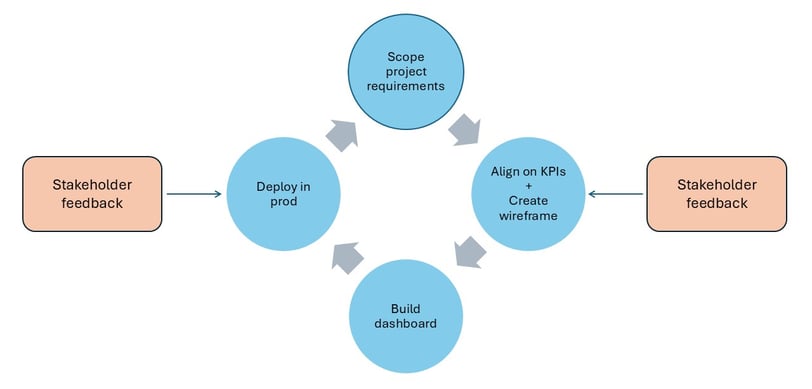
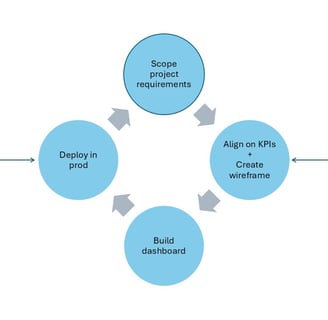
1. Scoping Project Requirements (ie. understanding the data)
This is one of the more time-consuming steps but crucially important. For your dashboards and data visualizations to be practical and useful it’s important to have a solid grasp of the data you will be working with.
Making charts is easy, making useful charts, not so much
Understand the Metrics: What do the KPIs mean? How are they calculated?
Explore the Data Sources: Identify the relevant data sources and assess their quality and reliability.
Identify Potential Challenges: Anticipate any data quality issues or limitations that may impact your analysis.
This is a great time to involve your stakeholders to get their inputs
Ask Questions: This is the time to ask all your questions (however “dumb” they might be). More often than not you will find your stakeholders are more than willing to make time for you. They too are eager to share their knowledge with you because they want you to truly understand the problem at hand.
2. Aligning on KPIs and other deliverables
Once you have a better understanding of the data, you should now have a good sense of what is possible. It’s important at this stage to get stakeholder buy-in on the metrics you plan to report on and the possible slices of data you can create. Note: we haven’t even started creating the dashboard yet. This is all still planning. You might wonder why we are spending so much time on planning and so little on execution. While your concerns are justified this is more to save time in the long run.
You’d rather spend more time upfront in this stage, learning about the data and aligning on the metrics to ensure that once you get started, no time is spent on the fundamentals. You also use this time to manage expectations with your stakeholders.
When aligning on metrics you are essentially letting your stakeholders know what is possible and what isn’t.
Create a wireframe: You should also create a wireframe of the dashboard. This is a mock design of the dashboard. You do not need to get fancy at this stage or spend an excess amount of time on visualizations. Create simple mocks in slides or excel. This process is to get your creative juices flowing and to try and visualize the end product. The mock also gives your stakeholders an idea of what you are thinking and also opens the door for them to participate in the creative process. By proactively sharing the mock with them you’re including them in the process, building trust with your partners and letting them know that you have open lines of communication set up.
3. Building the dashboard
Once you have successfully gone through the above steps, the fun part begins.
If you have followed the above steps, creating the dashboard now should be very straightforward to do. You are not starting from scratch, you have a better understanding of the problem and know exactly what you will be building based on the previous discussions.
Write SQL queries and create tables: This is also where you will be writing your SQL queries and creating your tables so that the data is in the right format for dashboard ingestion. This step can be cumbersome sometimes. Care needs to be taken here to ensure that the tables are at the right level of granularity — where there are aggregations they are done correctly and make sense in the context of the table and the final visualization.
Try to make all the aggregations in the SQL scripts and do not leave calculations for the dashboard to do
Dashboarding tools can aggregate data and do various calculations (SUM, MIN, MAX etc). As far as possible you should try to get these aggregations done in the sql script and not leave it for the dashboard. This ensures faster 1) dashboard load times, 2) improves performance and 3) makes it easier to debug errors in the dashboard.
Having said that, I do understand there are situations where dashboard calculations are a must, especially if you are trying something more complex like Level of Detail expressions in Tableau.
The general idea still holds true. Try to limit calculations in the dashboard as much as possible and do most of the heavy lifting in the scripting stage.
4. Deploying in Prod
Once the tables are ready and the dashboard has been built, it’s time to deploy in prod and let the world see your work.
Soft launch to early users: I prefer first launching the dashboard to early users for feedback — folks who are intimately aware about the project and have a deep understanding of the data. This step allows you to catch errors and any other issues that may be present in the output.
Depending on the dashboard’s usage you might get requests for more features and create visualizations for more slices of data.
Do not think of your dashboards as one and done. Think of them as versions instead. After version 1 is done, it’s time to take the feedback, regroup and plan for the next version.
Once you have enough feedback you restart the process and go to step 1 and see which of the feature requests are truly possible and what is the level of effort required.
Run the steps again and you should be well on your way to your next launch!